
 Membrana MBR
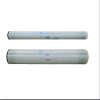 Membrana de ósmosis inversa
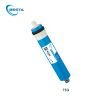 Membrana RO residencial
 Membrana UF
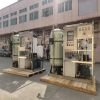 Planta de tratamiento de agua
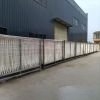
 Máquina residencial RO
 Sistema RO salobre
 Sistema de agua de mar/planta SW ro
 Filtro de bolsa
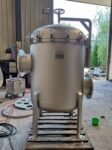 Filtro de cartucho
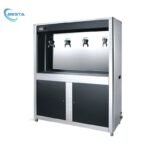 Sistema de filtración de agua comercial
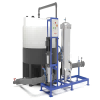 Sistema de limpieza de membrana(Titubear)
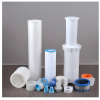 Accesorios de consumo

Introducción
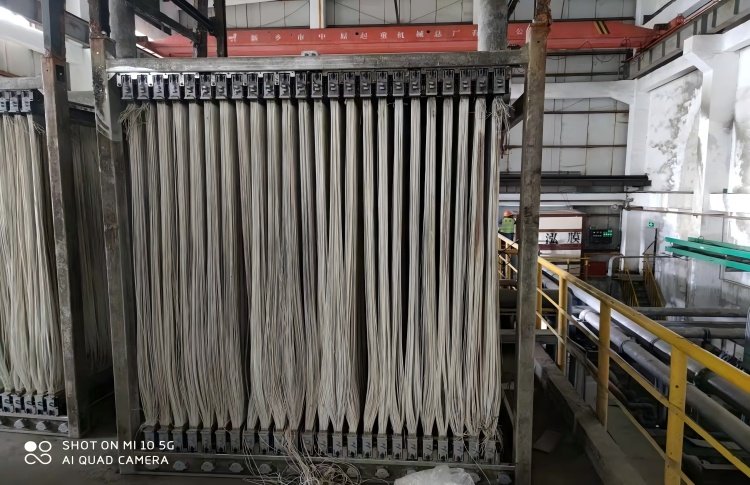
Biorreactor de membrana (MBR) sistemas Se utilizan ampliamente en el tratamiento de aguas residuales debido a su alta eficiencia y diseño compacto.. Sin embargo, Un desafío crítico que enfrentan los operadores de plantas es predecir la vida útil de la membrana exactamente. El reemplazo prematuro aumenta los costos, mientras que el reemplazo retrasado corre el riesgo de fallar el sistema.
Este blog explora una enfoque basado en datos para predecir la vida útil de la membrana MBR, usando tasas de descomposición de la permeabilidad industrial como métrica clave. Analizaremos datos del mundo real de una planta MBR operativa de 10 años y brindaremos información práctica para optimizar los programas de mantenimiento..
Por qué es importante predecir la vida útil de la membrana MBR
Las membranas MBR se degradan con el tiempo debido a:
-
Abordaje (depósitos orgánicos/inorgánicos)
-
Exposición química (agentes de limpieza, oxidantes)
-
Desgaste mecánico (fregado por aireación, fluctuaciones de presión)
Sin una predicción adecuada de la vida útil, cara de las plantas:
✅ Tiempo de inactividad no planificado (falla repentina de la membrana)
✅ Mayores costos operativos (reemplazos frecuentes)
✅ Reducción de la eficiencia del tratamiento. (disminución de la calidad del agua)
Un estudio de Universidad Xi'an Siyuan demostrado que tasas anuales de deterioro de la permeabilidad puede pronosticar con precisión la vida útil de la membrana, Ayudar a las plantas a optimizar los presupuestos y el rendimiento.3.
Métrica clave: Permeabilidad Industrial (VMD)
Los investigadores definen Permeabilidad Industrial (VMD) como:
«El volumen de agua (m³) filtrado por 1,000 m² área de membrana, por dia, bajo 1 kPa presión transmembrana.»
Esta métrica ayuda a estandarizar las comparaciones de rendimiento entre diferentes sistemas MBR..
Tabla de datos: Decadencia anual de VMD en una planta MBR de 10 años
| Año | promedio. VMD (m³/día·kPa·1000m²) | Tasa de deterioro anual |
|---|---|---|
| 1 | 8.2 | – |
| 2 | 7.9 | 3.66% |
| 3 | 7.6 | 3.80% |
| 4 | 7.3 | 3.95% |
| 5 | 7.0 | 4.11% |
| 6 | 6.7 | 4.29% |
| 7 | 6.4 | 4.48% |
| 8 | 6.1 | 4.69% |
| 9 | 5.8 | 4.92% |
| 10 | 5.5 | 5.17% |
*Fuente: Sistema A²/O-MBR de la Universidad Xi'an Siyuan (3520 días de datos operativos)3*
Información clave:
-
Tasa de descomposición promedio: ~4,36% anual
-
Umbral de reemplazo de membrana: ~30 % de pérdida de VMD (Año 7-8)
Cómo aplicar este método en su planta
Paso 1: Recopile datos operativos diarios
Pista:
✔ Producción diaria de agua (m³/día)
✔ Presión transmembrana (TMP, kPa)
✔ área de la membrana (m²)
Paso 2: Calcular VMD & Identificar tendencias de deterioro
Usa la fórmula:
VMD=Producción Diaria de Agua (m³)Área de membrana (1000 m²)×TMP (kPa)
Trazar promedios anuales para detectar patrones de descomposición..
Paso 3: Predecir la vida útil & Reemplazos de planes
-
Si la descomposición excede 5% por año, considerar:
-
Limpiezas más frecuentes
-
Actualizaciones del material de la membrana (P.EJ., PVDF con revestimientos antiincrustantes)
-
-
Si la descomposición permanece por debajo 3% por año, Las membranas pueden durar más allá de 10 años.
Estudio de caso: Las soluciones MBR de larga duración de BestaMembrane
En BestaMembrana, nuestro Membranas MBR basadas en PVDF están diseñados para:
🔹 Tasas de descomposición más bajas (~3,5%/año)
🔹 Mayor resistencia química (ph 2-11, 35,000 ppm·h tolerancia al cloro)
🔹 Vida útil extendida (8-10 años)
Para la punta:
Combina nuestras membranas con Monitoreo impulsado por IA a:
✅ Detecta signos tempranos de contaminación
✅ Optimizar los ciclos de limpieza
✅ Maximizar la eficiencia operativa
Conclusión
Predecir la vida útil de la membrana MBR no es una conjetura: es una ciencia basada en datos. Por seguimiento Tasas de decadencia de VMD, las plantas pueden:
✔ Reduzca el tiempo de inactividad inesperado
✔ Reduzca los costos de reemplazo 20-30%
✔ Mantener una calidad constante del agua
Para Membranas MBR de mayor duración, explorar Las soluciones de alto rendimiento de BestaMembrane hoy!
